
Portfolio indicators
Progress, cost position, safety and procurement across every tracked project, in one view that a board member can read without a briefing.
Tools: reports & dashboards
The monthly pack assembles itself from the record: measured progress, dated imagery and portfolio indicators, instead of a week of engineers screenshotting and pasting.
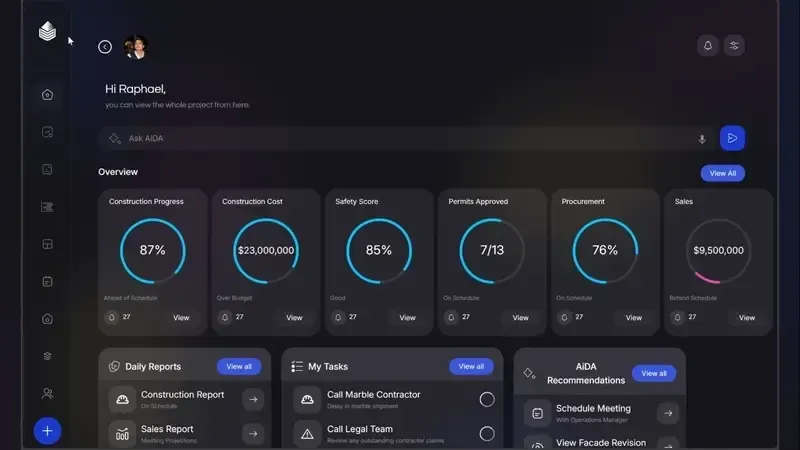
Progress, cost position, safety and procurement across every tracked project, in one view that a board member can read without a briefing.
Generated from each day’s captured imagery rather than written from memory at the gate, with the same standard for every project, every day.
Progress tables, dated stills and commentary slots assemble into a distributable report in minutes, with the imagery already attached.
Every claim in the report links to the record behind it. Recipients who want to verify a line can, without asking anyone.
The saving
On most projects, the people compiling the monthly report are the same engineers who should be walking the works. Generating the pack from the record returns those days.
Just as importantly, a generated report is consistent: the same measures, the same format, project after project. That consistency is what makes a portfolio comparable at all.
Questions
The standard pack covers progress, evidence and indicators; branding and section structure are configured per organisation during onboarding.
Access is role-based. An owner’s portfolio view, a project team’s working view and a lender’s summary can coexist on the same record.
No. It feeds it. Oblix is the record and the measurement; exports drop into whatever project controls stack you already run.
A 20-minute walkthrough of Oblix on a real project. No slides, no obligation.