
By building, by discipline
Mechanical, electrical, architectural, structural: each tracked separately per building, so slippage has an address.
Tools: progress tracking
A progress table where every number is measured from the captured record, and clicking any figure opens the imagery it came from.
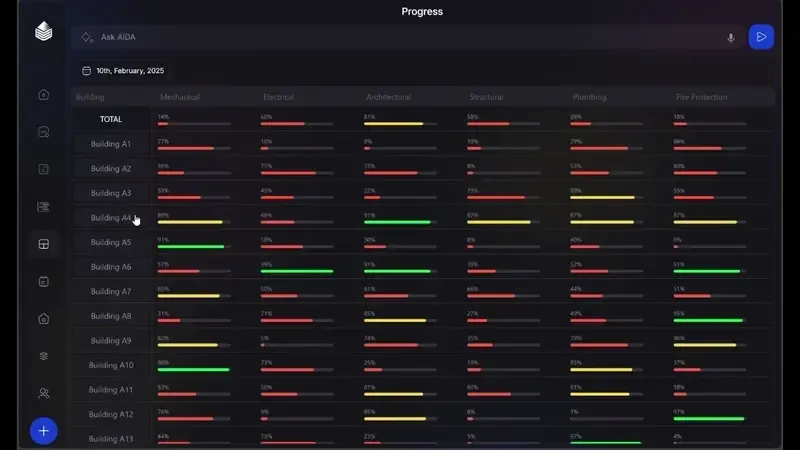
Mechanical, electrical, architectural, structural: each tracked separately per building, so slippage has an address.
Planned dates come from your schedule; actuals come from the record. The delta is visible the week it opens, well before month end.
Every capture updates the measured position, so momentum (or the lack of it) shows up as a trend instead of an anecdote.
Every cell traces to dated, located frames. A challenged number is settled by opening it, without scheduling a site visit.
The difference
Most progress reporting aggregates what foremen and subcontractors report upward, which is why it drifts optimistic until the month it suddenly cannot. Measurement from imagery does not drift.
The schedule view ties measured progress back to the critical path, so the question moves from “what per cent are we at” to “which zones threaten the date”, the question that was always the point.
Questions
From your existing programme. The schedule is imported and mapped to zones once, then actuals accumulate against it automatically.
Yes. Tables and dated stills export directly, and the reports tool assembles them into the monthly pack.
It is built for that case. Portfolios and multi-building projects roll up to a single view without losing per-building detail.
A 20-minute walkthrough of Oblix on a real project. No slides, no obligation.